Creates posterior density plots of MCMC samples.
density_plots.RdCreates posterior density plots of MCMC samples.
Examples
configured_data_path <- system.file("extdata", "configured_data.Rds", package = "metainsight")
configured_data <- readRDS(configured_data_path)
# n_adapt and n_iter are set low to run quickly, but should be left as the
# default values in real use
fitted_bayes_model <- bayes_model(configured_data = configured_data,
n_adapt = 100,
n_iter = 100)
mcmc <- bayes_mcmc(model = fitted_bayes_model)
density_plots(fitted_bayes_model$mtcResults, mcmc$parameters)
#> [[1]]
#> `stat_bin()` using `bins = 30`. Pick better value `binwidth`.
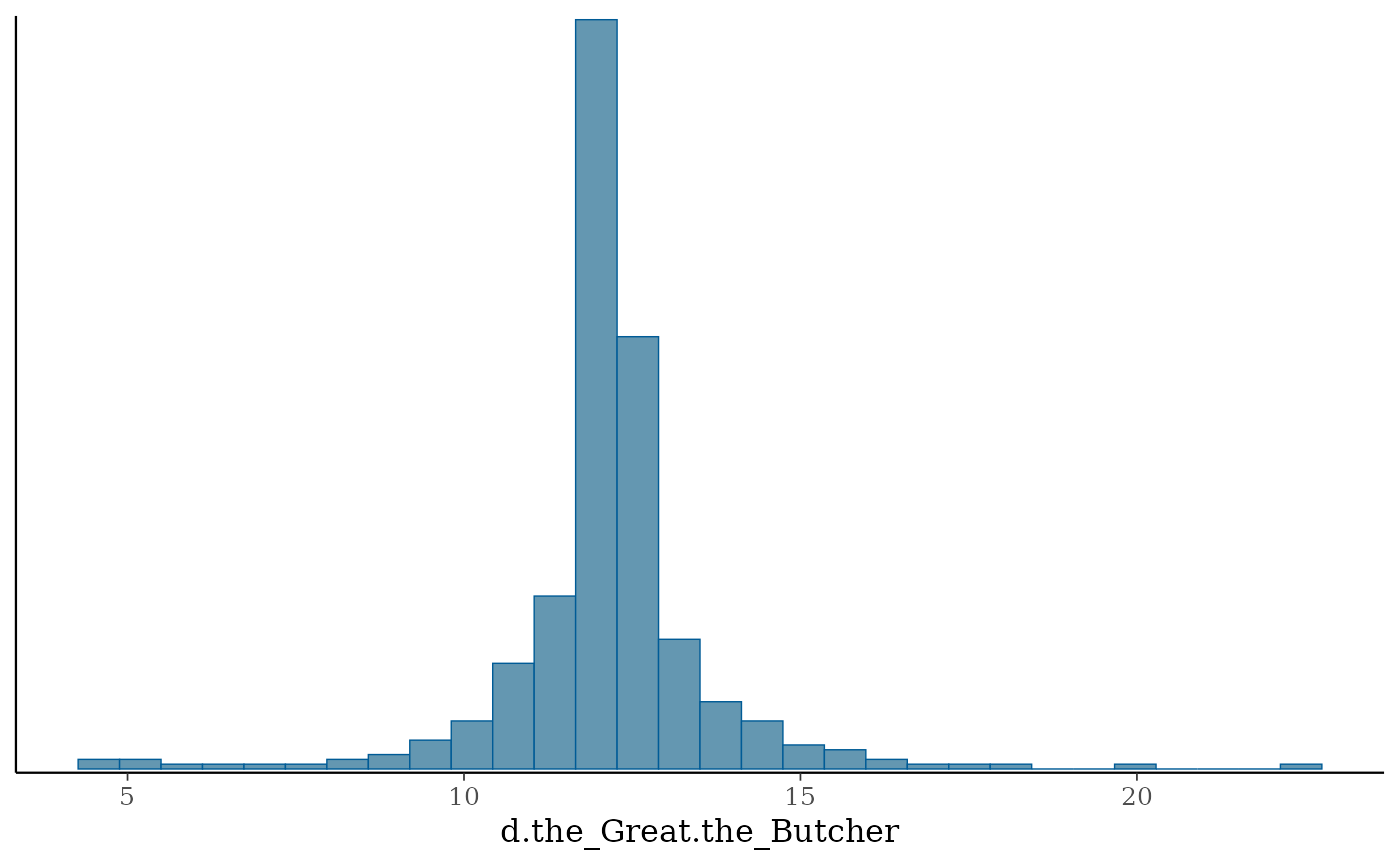 #>
#> [[2]]
#> `stat_bin()` using `bins = 30`. Pick better value `binwidth`.
#>
#> [[2]]
#> `stat_bin()` using `bins = 30`. Pick better value `binwidth`.
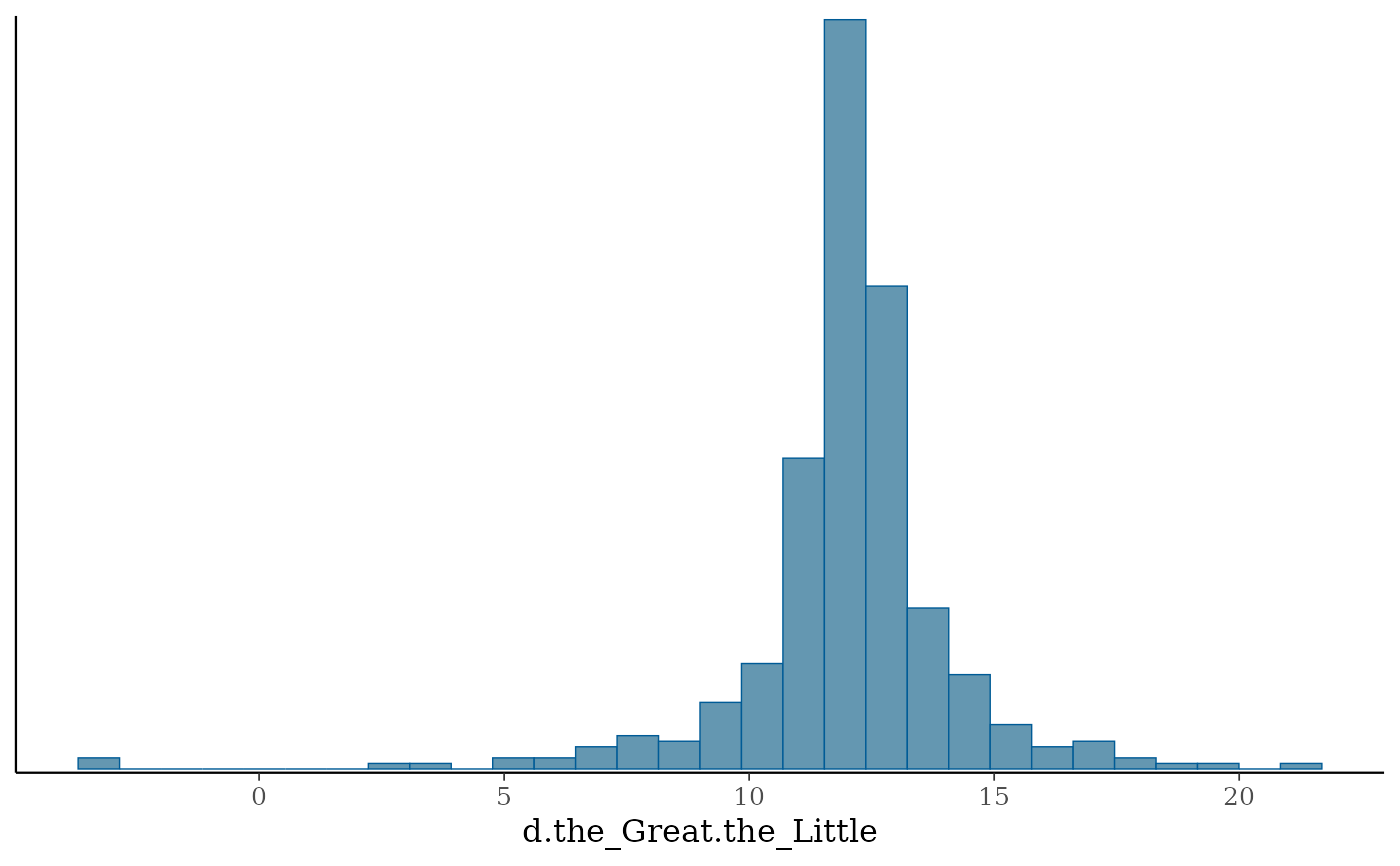 #>
#> [[3]]
#> `stat_bin()` using `bins = 30`. Pick better value `binwidth`.
#>
#> [[3]]
#> `stat_bin()` using `bins = 30`. Pick better value `binwidth`.
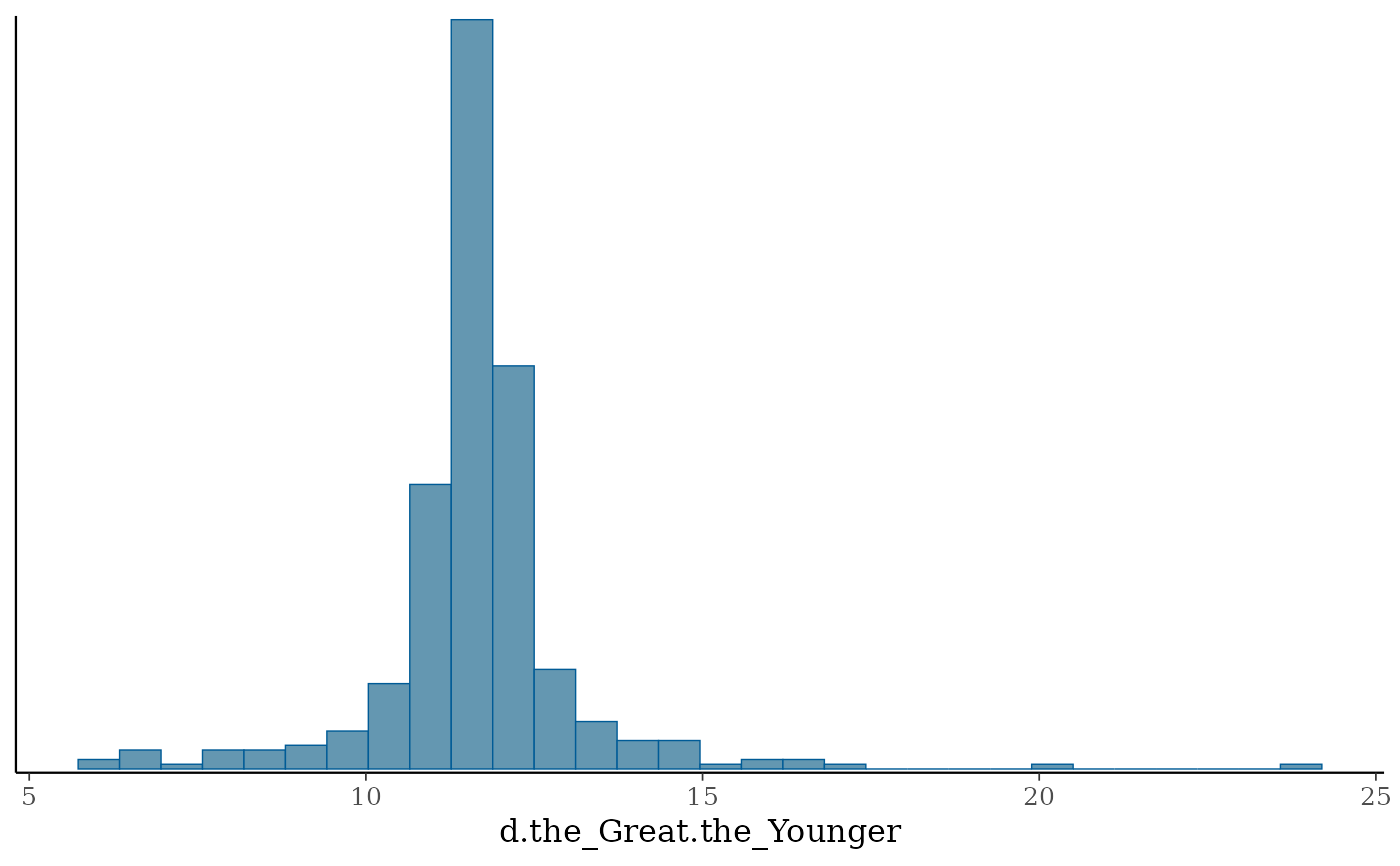 #>
#> [[4]]
#> `stat_bin()` using `bins = 30`. Pick better value `binwidth`.
#>
#> [[4]]
#> `stat_bin()` using `bins = 30`. Pick better value `binwidth`.
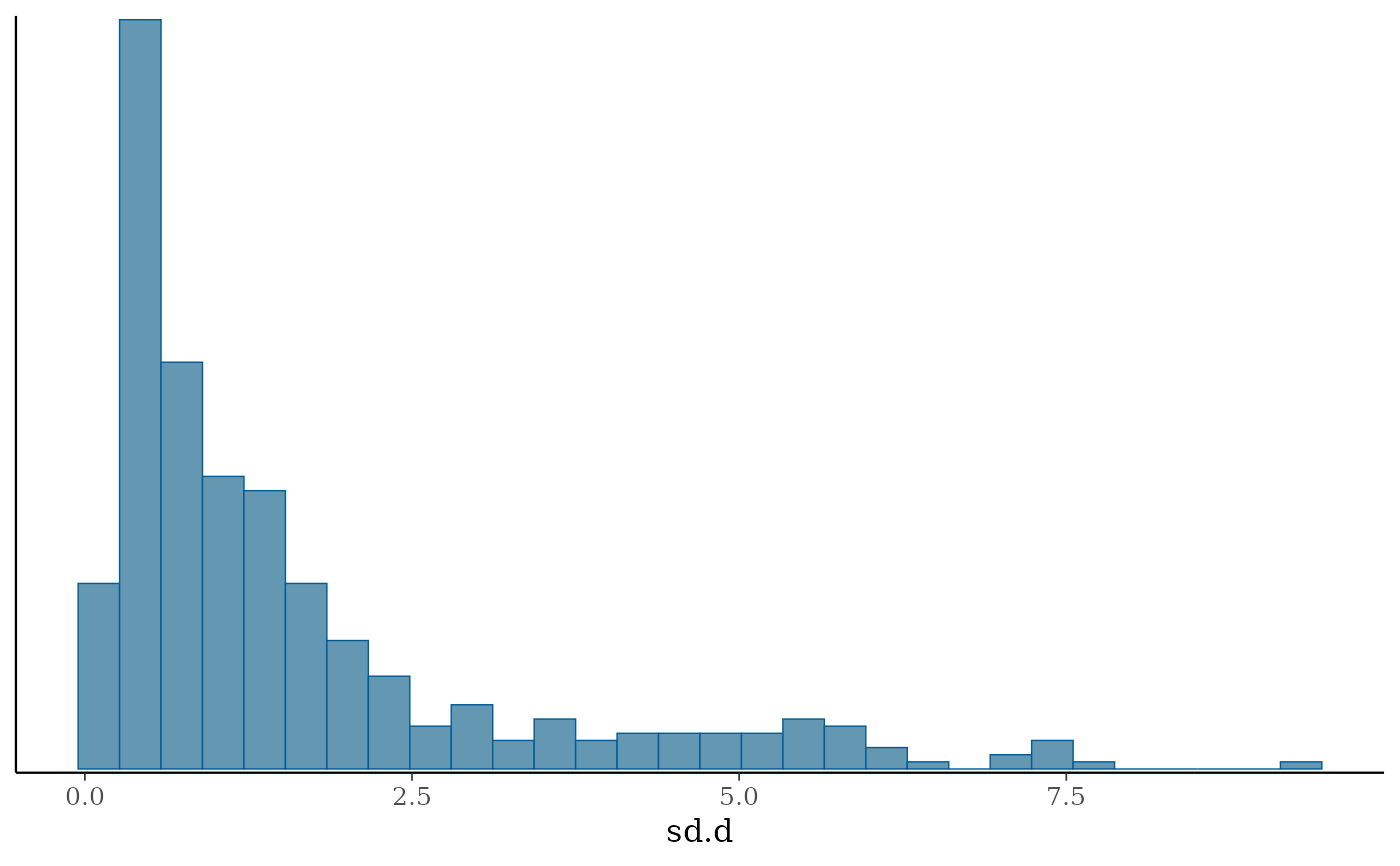 #>
#>